Stock Market Crash in 2020 Due to Coronavirus
Cfefinances
This newsletter is intended to help investors make sense of the stock market’s decline during a devastating coronavirus outbreak that has claimed thousands of lives worldwide. The market dropped more than 30% — the fastest drop in its history. Financial advisors have had their hands full helping clients stay invested and make sound decisions. As my family and I watched the market fall, we didn’t really have a chance to sell; the decline was so rapid that by the time we considered it, it felt too late. Staying invested in a falling market is genuinely hard, but there is a real benefit: reinvested dividends and regular retirement contributions buy more shares at lower prices. This is called dollar-cost averaging. Investors who lived through the 2008 financial crisis and stayed invested will tell you their wealth grew significantly as a result — this author included.
My wife, our three children, and I all have a reasonable grasp of how markets work. We talked through the decline together, and we agreed the market would recover once the virus was contained and Americans could return to work. My oldest son, a financial advisor, shared a great analogy: the market was in a steep correction that was like a knife falling from the sky — it would eventually land and hit a bottom, so we just needed to be patient. He was also confident the market would come back. My youngest son, a software engineer in the financial sector, reminded me how valuable technical analysis can be for identifying a potential bottom — and we’ll show you how in this article. My daughter, a director at a pharmaceutical company, and my wife, a trauma registrar at a hospital, were both tremendously supportive through a difficult stretch. The economy is now in recession and the coronavirus continues to spread — a lot to digest. My conclusion was that it was reasonable to take some profits and build up a cash reserve, though at the time of writing we remain fully invested.
The market’s behavior suggests investors hit the panic button, and the speed of the move may have helped us reach a bottom quickly, as you can see on the S&P 500 chart below. The index broke through 2,300 and bottomed near 2,200 on March 23, 2020. Calling a bottom is always tricky, but it does look like that was one. The strongest tell was the bounce after the U.S. federal government passed a $2 trillion stimulus bill on Tuesday, March 24, 2020, which lifted the S&P 500 back to 2,400. The stimulus is designed to support Americans and businesses through the coronavirus-driven recession, and the Federal Reserve has separately added liquidity to the financial system more than once. In the top-left corner of the chart below, you can see the S&P 500 had climbed to 2,874.56 by April 17, 2020. Good news!
What this means for investors is that we can return to CFE Finances’ core approach: fundamentals and technical analysis. At the same time, the virus is a reminder to keep up six-foot social distancing with friends, relatives, and coworkers. The coronavirus is still spreading rapidly, so let’s stay positive and help each other where we can. Reviewing stocks and their financial statements is a productive way to pass the time. 
Below is a chart of the S&P 500 ETF (SPY), which showed the same drop of more than 30% as the S&P 500 index. Three moving-average indicators are plotted: 50-day, 100-day, and 200-day. The blue trend line for SPY dropped to 225.00 as the market fell so quickly (in roughly two weeks). The purple line is the 50-day moving average at 292.49, the light-blue line is the 100-day at 301.32, and the yellow line is the 200-day at 305.99. The strongest signal on the chart is the upward-sloping blue trend line, which shows SPY climbing from the lows and reaching 264.86 (highlighted in red). The top-left corner of the chart also shows SPY improving to 286.54 on Friday, April 17, 2020. More good news! 
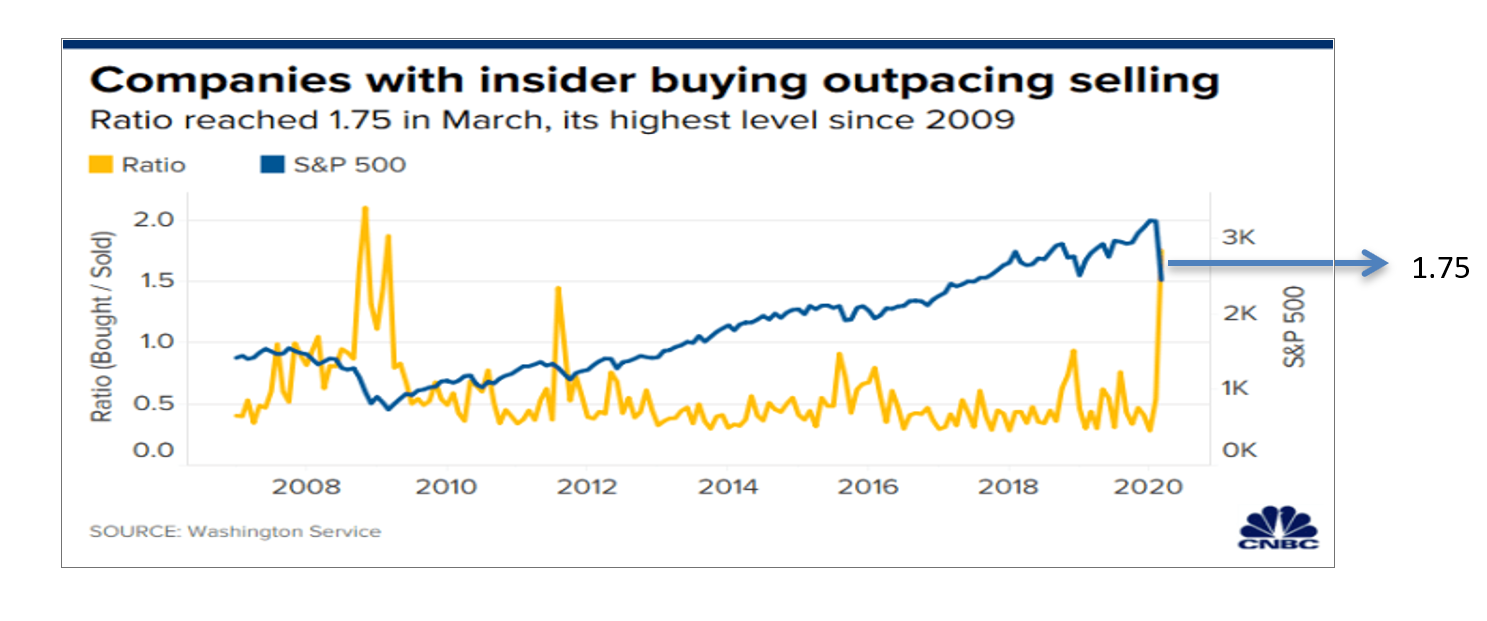
Another chart below shows insider buying — corporate executives purchasing their own company’s stock — outpacing insider selling while the market was heading toward its low. The ratio stood at 1.75 for March 2020, the highest reading since March 2009, according to Washington Service, a provider of insider-trading data and analytics. Normally the ratio is below 1.00, meaning executives are net sellers of their own stock. A reading above 1.0 is good news for investors: it signals that the people running these companies believe they have sufficient cash to navigate the downturn and that their share prices will appreciate. Among the names mentioned were Dell and Wells Fargo. Large investors were buying too: Berkshire Hathaway purchased about $45 million of Delta Air Lines stock, and Blackstone bought more than $50 million of Cheniere Energy. Remember: the stock market looks roughly six months ahead of the current economy.
 Through the coronavirus and the market turmoil, there have been some very strong days recently — the best three-day rally since the 1930s ran from March 24 to March 26, 2020 — and they point to promising recoveries in investments you may already own or could own. Keep studying company stocks, invest for the long term, and it should pay off handsomely in the future. Good luck and happy investing from CFE Finances! Stay safe and healthy. We’ll be in touch with another newsletter soon. If you have any questions or concerns, please email us from our contact page.