2018 Stock Market Correction
Cfefinances
The stock market’s drop in December 2018 was deep enough to qualify as a correction — the worst December performance since 1931 — driven by investor fears of a U.S. economic slowdown in 2019, even as corporate fundamentals remained strong. We at CFE Finances like to share technical data and market commentary with our bullish customers and fellow investors. The chart below shows how the SPDR S&P 500 Index ETF (SPY) has performed from 1996 to 2018 (Source: SeekingAlpha; “A Market Bottom Could Be Near” by R. Morwa).
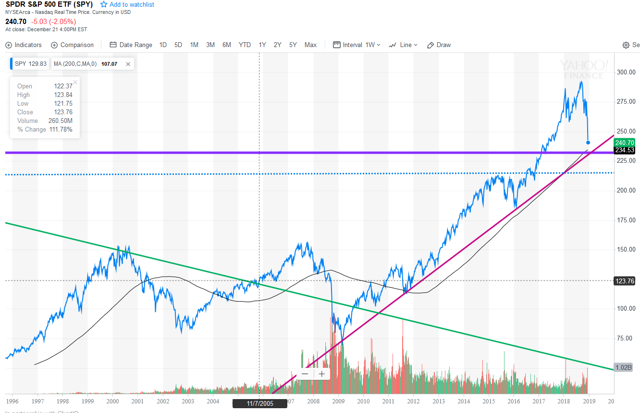 What the chart shows is a trend line (red) connecting the market corrections of 2007, 2011, and 2016 through the end of 2018. The flat purple line sits at SPY 234.54, a 50% retracement from the 2016 lows, which is exactly where the red trend line intersects. The red line traces the most significant market drawdowns from 2007 through 2018. Where the red line and the purple line cross is a well-established technical support level, which looked like it would offer a strong buying opportunity — the blue price line was sitting just above it (Morwa). The green line traces declining volume on every significant pullback since 2011. Volume is also shown at the bottom of the chart. The blue line represents SPY, hovering just above the flat purple trend line (about 3% above it). The Seeking Alpha author argued that bulls would not let the market drop all the way to that flat line, because breaking it would have triggered a much larger sell-off. He was right: the bullish day arrived right after Christmas, on December 26, 2018, following a strong retail sales number — the largest increase in six years. That sparked the biggest single-day point gain in Dow Jones Industrial Average history, up 1,086 points, or 4.98%. For now, there’s a good chance this 2018 correction is over, since buyers successfully defended SPY (at 246.18) and the broader indexes from breaking lower. Will the Santa rally extend into the new year? There’s a reasonable chance it will. Now is a good time to add great companies to your portfolio while they’re still on sale.
Congratulations for staying long through this treacherous market. Corrections like this one tend to set up new highs. Dow 30,000 may be in sight over the next 3 to 5 years. Markets are volatile right now due to uncertainty around the China trade war and the possibility of further rate hikes in 2019, and long-term investors will need to remain patient. But over time, stocks have consistently produced high returns for investors.
We all need to do our due diligence: review your companies’ financial statements and make sure sales and earnings continue to grow quarter over quarter and year over year. A good (and free) place to review your portfolio is your local library — read the Value Line Surveys for the stocks you own and for the ones on your wish list.
Remember: when you buy shares of a company, you own a piece of that business. The stock will appreciate when sales and earnings — that is, profits — grow. Reinvest your dividends to compound your share count over time and lower your average cost basis. Good luck and happy investing from CFE Finances. We’ll be in touch with another newsletter soon. If you have any questions or concerns, please email us from our contact page.